The Takeaway - CBSE Class 12 results (2026)
The Takeaway is a series of data stories. Each post picks one or more public dataset(s) and finds what the numbers are actually saying.Here, I look at the CBSE Class XII 2026 results and what they reveal about education, geography, gender and who actually delivers better outcomes for students.
The CBSE Class XII results for the academic year 2025-26 were released on 13 May 2026. This year’s CBSE XII exams were mostly uneventful (as they should be) , save for disruptions due to the conflict in Middle East , security QR codes rickrolling unsuspected students,and QR codes redirecting people to influencers’ 1 social media accounts .
This is also the first year, that CBSE has done full-scale on-screen marking for Grade 12 exams2.
At the same time, the CBSE also dropped a press release about the results. I wish the press release included a lot more granularity on the data, but nevertheless, I felt it provided a snapshot about the state of private schools in this country as most CBSE schools are independent (i.e. private unaided). This is my attempt to interpret and distill the data presented.
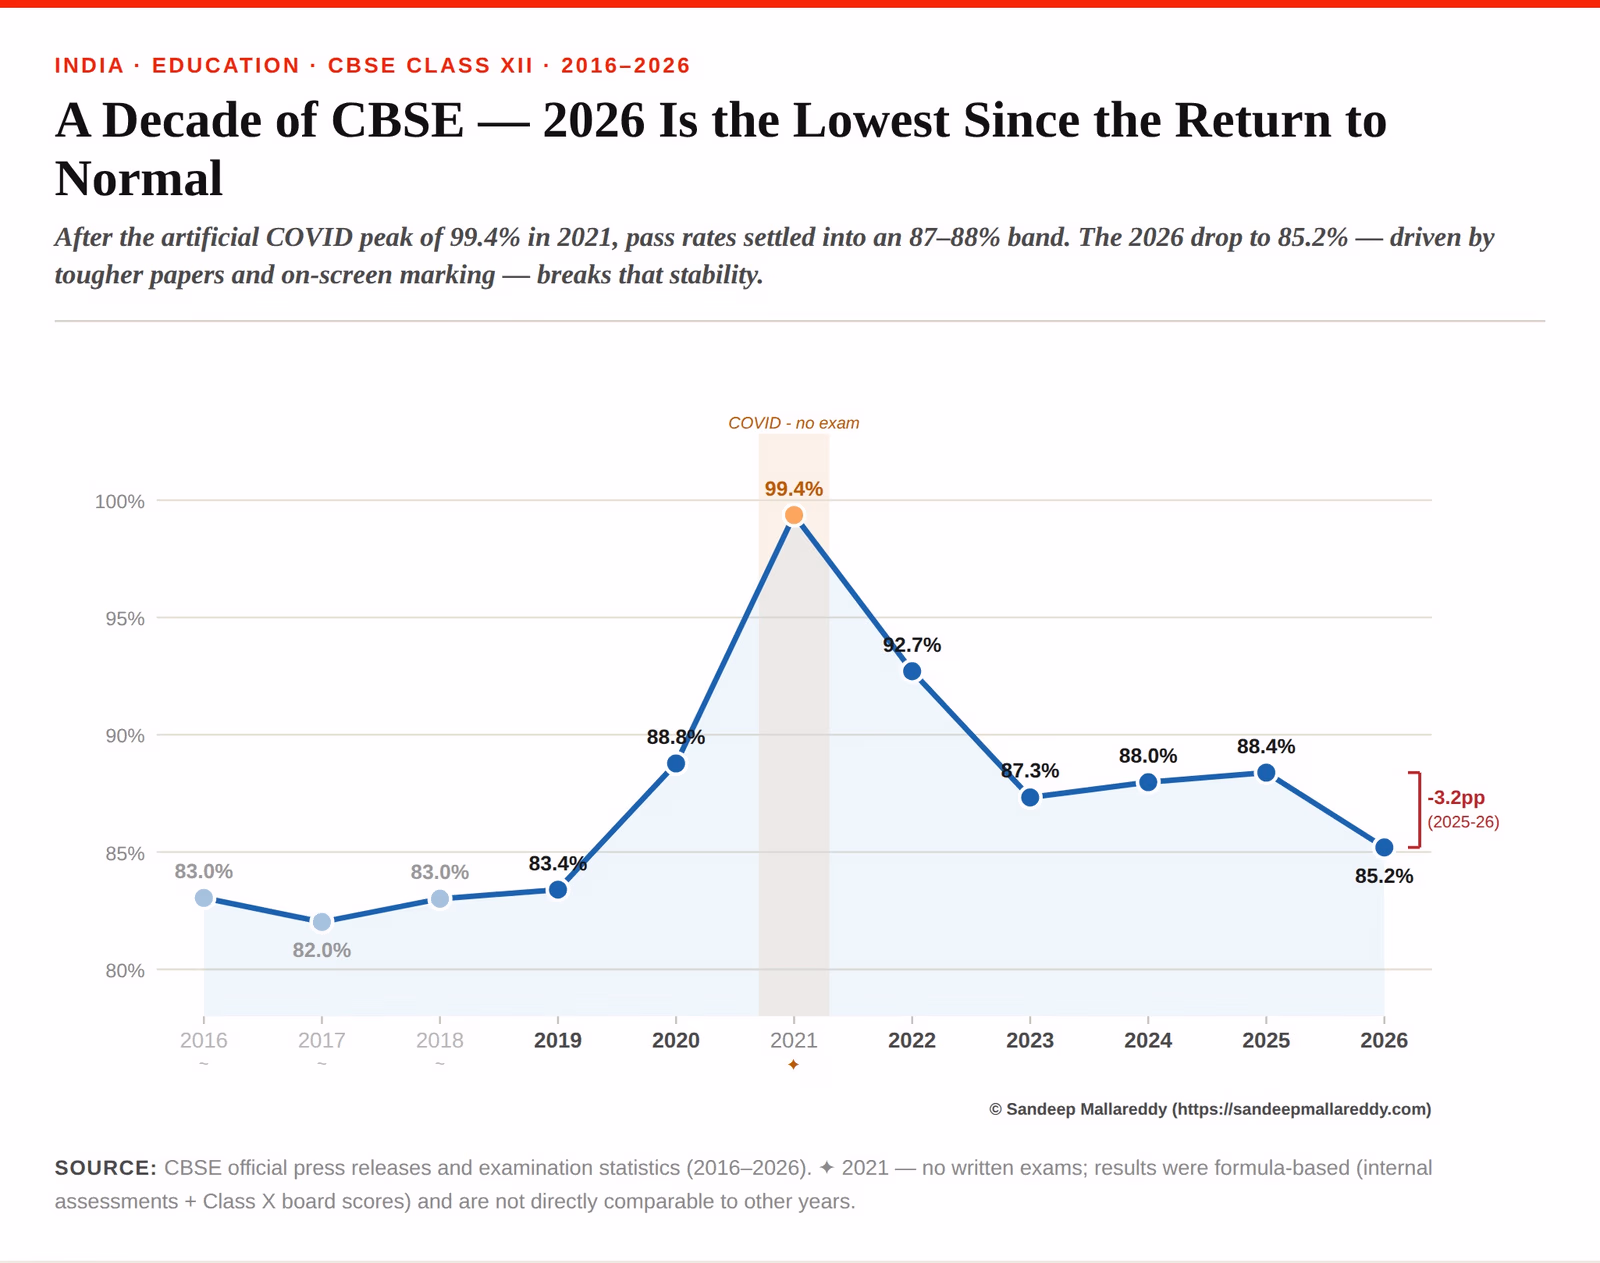
the floor is dropping
To pass an exam , students need to score at least 33% in each subject (theory and practical components separately). While it feels like a pretty low bar - only 85.2% could actually clear the bar. This is the lowest pass percentage since the post COVID era i.e. 20223 and almost 3 percentage points (pp) below 2025 results - presumably driven by tougher exam paper and the new on-screen marking .
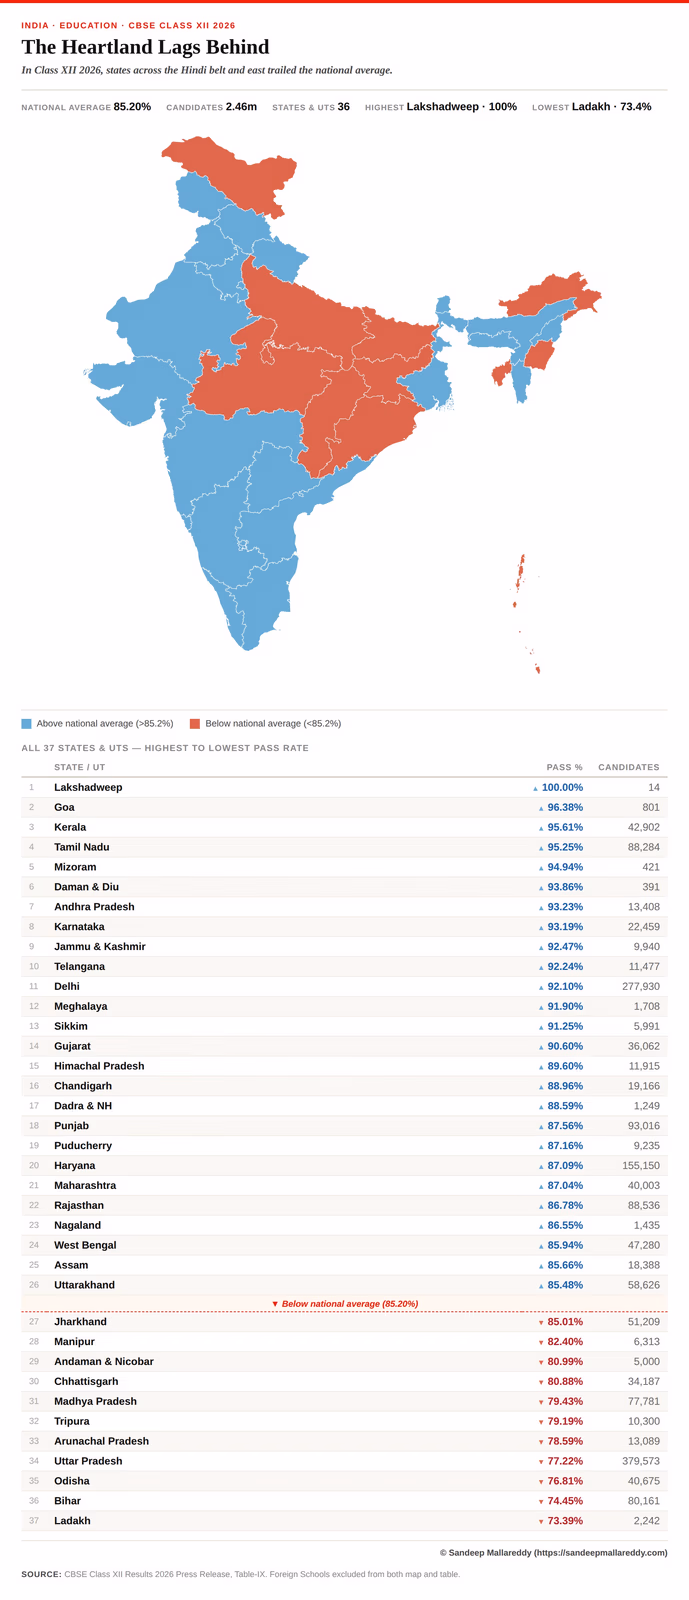
geography is destiny
State wise performance tells us a different story. The Hindi heartland states of Uttar Pradesh, Bihar, Madhya Pradesh, Jharkhand, Chhattisgarh; Odisha in the South ,and Arunachal, Tripura, Manipur in the East , and the newly formed UT of Ladakh have below average pass percentage numbers. This is interesting, because in all of these states, the independent private schools seem to reflect the poor education infrastructure and investments that have plagued these regions.
If you are a private school chain, these states represent a great opportunity for market expansion. Clearly, there is a need for better supply of quality education.
All the Southern states continue their academic dominance by delivering better pass rates at scale. In the Northern states - Delhi , Jammu & Kashmir, and Gujarat stand out for pass rates above 90%.
the great gender imbalance
While there is near parity across enrollments between boys and girls across types of schools, the overall enrollment of boys is almost 9 pp more than that of girls, with UP, Bihar and Haryana driving most of these gaps. Bihar is the starkest with girls being only 37% of the enrollment.
Despite the differences, girls have consistently been outperforming boys on the exams over the past decade.
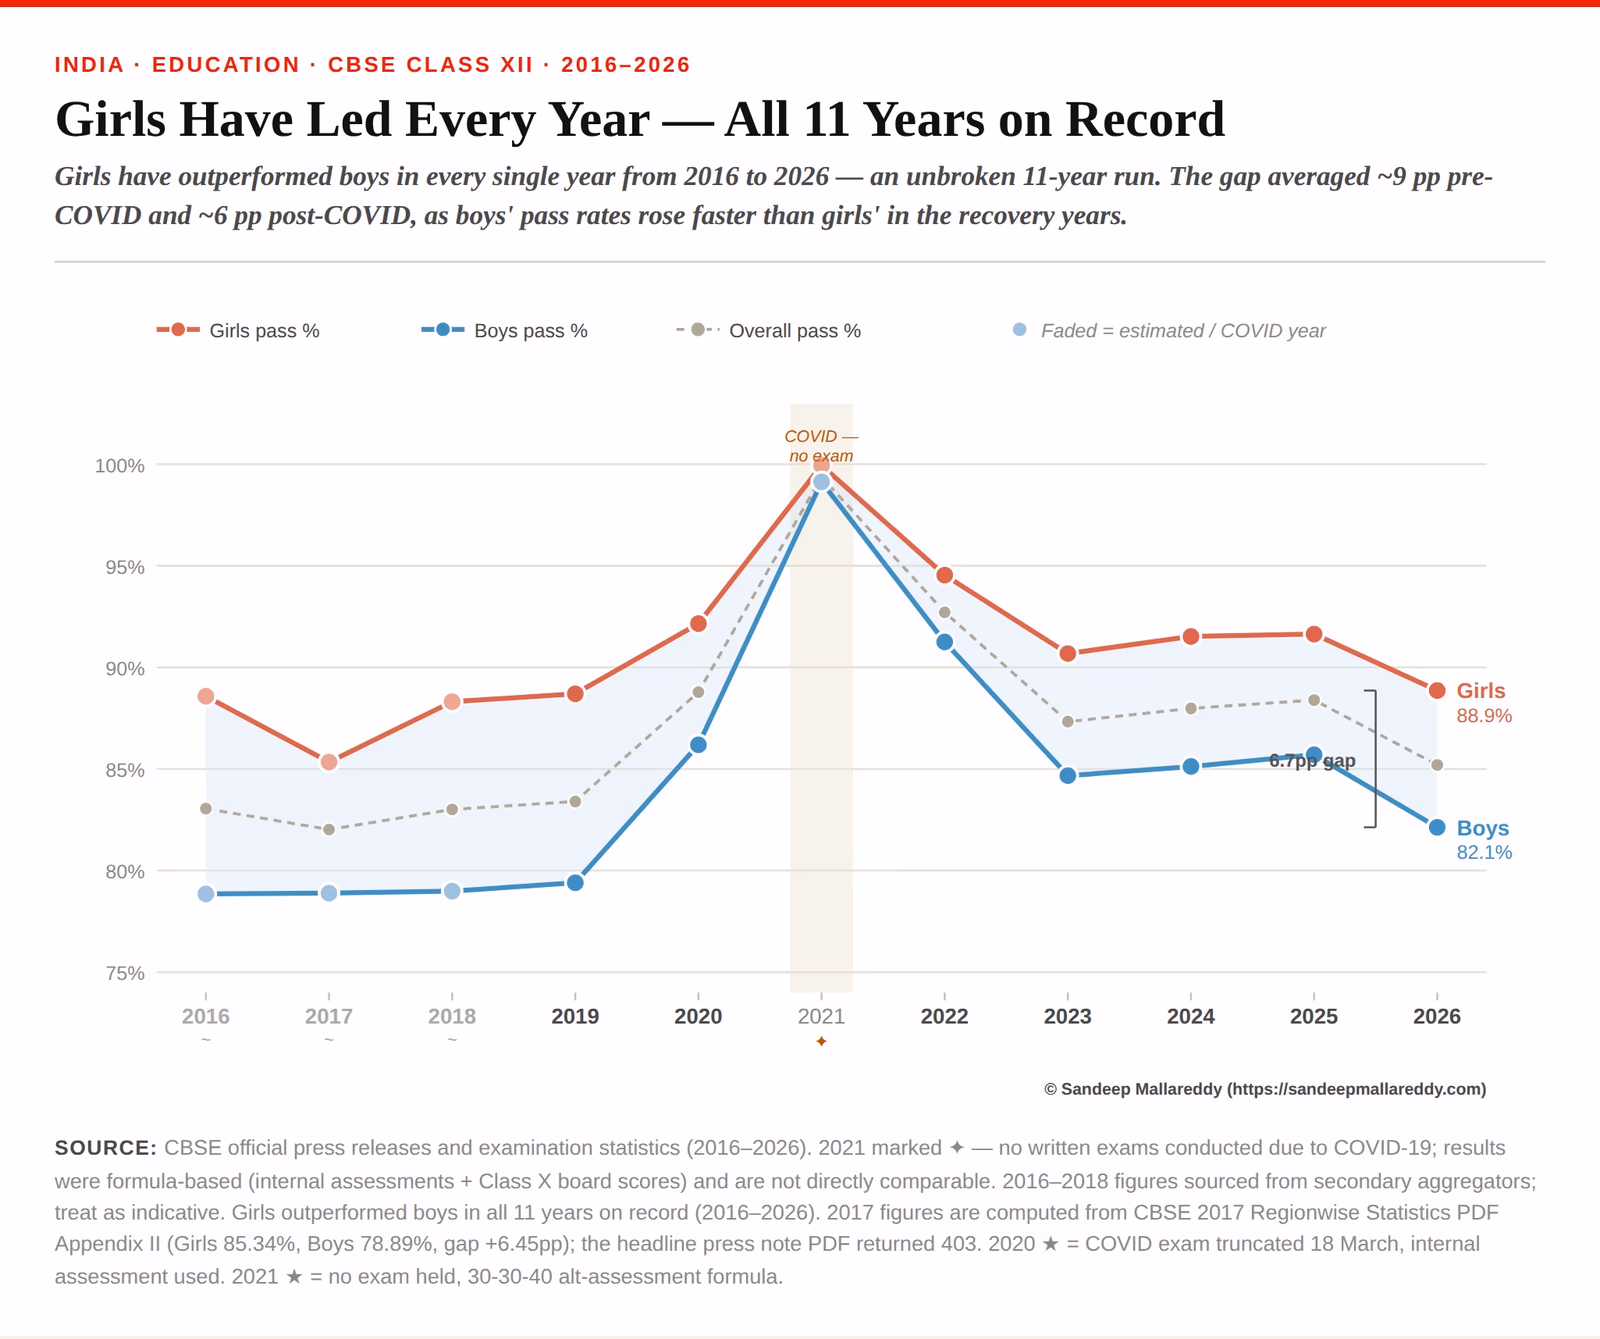
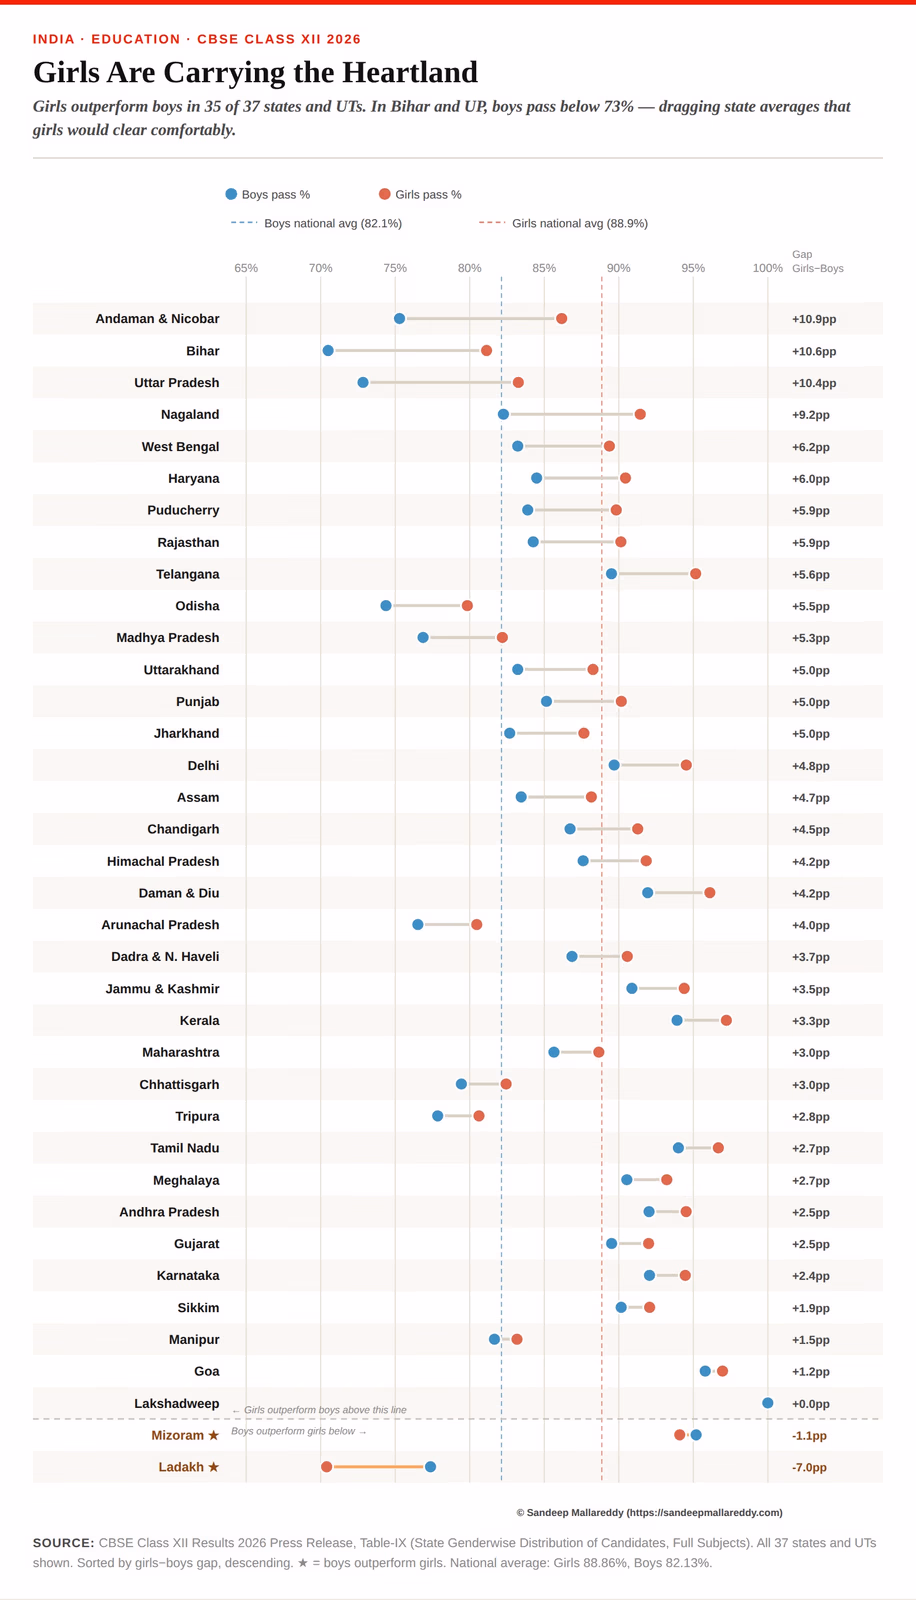
This year too, the trend continues, with girls outperforming boys in almost all states4. On average girls have 7 pp greater pass rates than boys. In low performing states like UP and Bihar, the gaps are even greater at 10 pp. In these states, girls do better but are systematically underrepresented in who gets to sit the exam.
state vs the markets
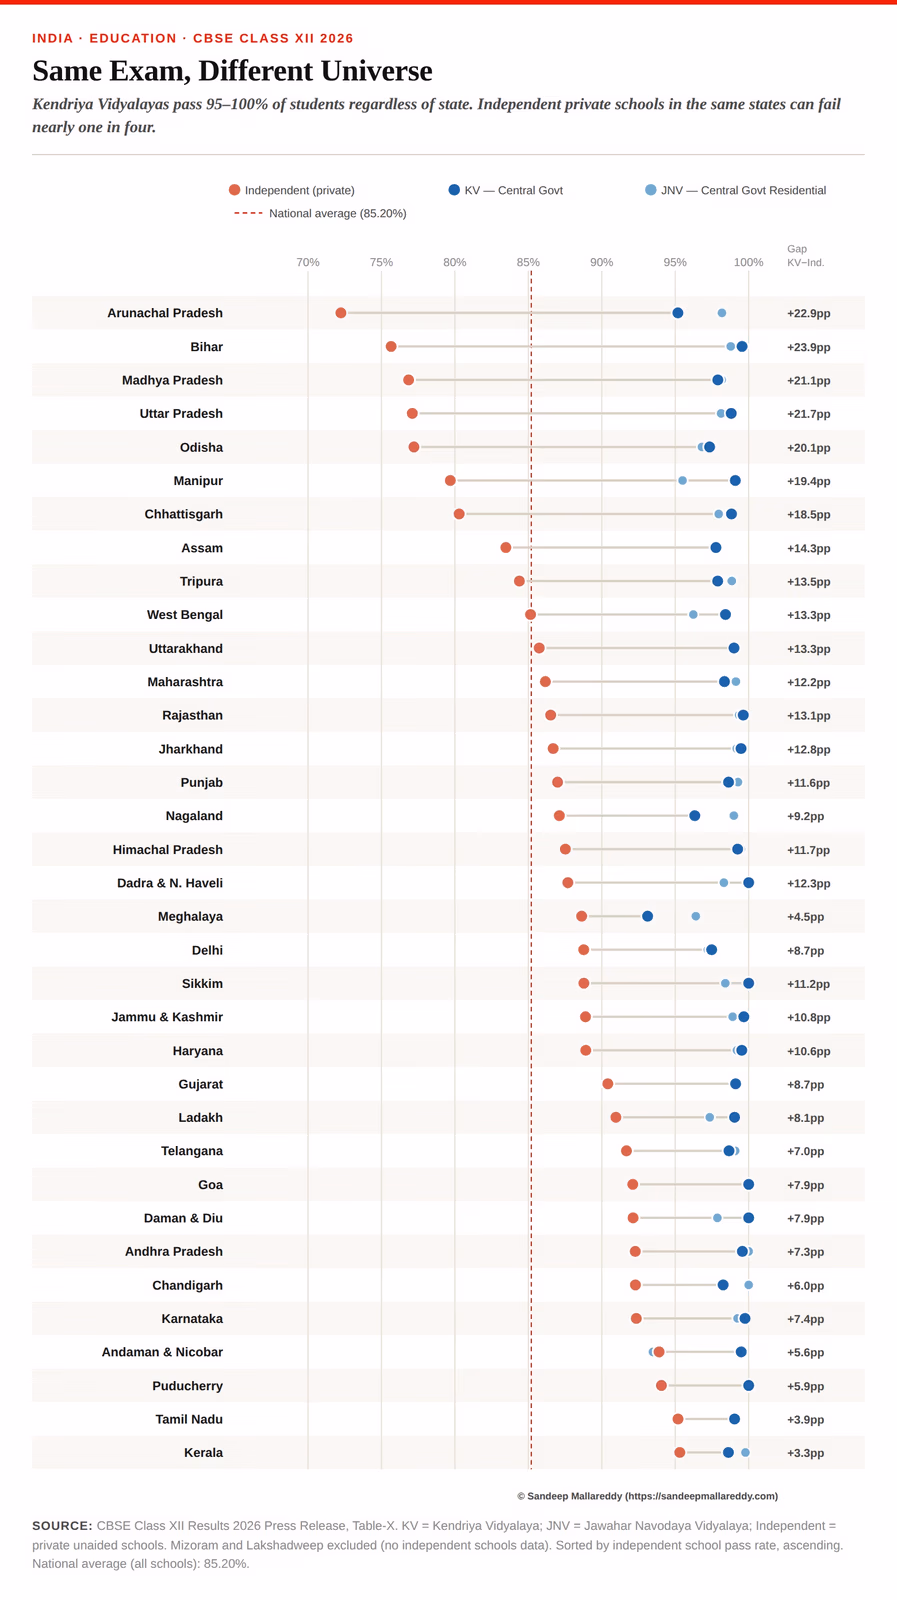
A majority of CBSE Grade 12 test takers go to private unaided independent schools across states. Most state-run schools follow their regional state boards and are invisible in the CBSE data. However, there are exceptions. States like Delhi, Arunachal, Sikkim, Haryana, Tripura and others have state-run schools that follow the CBSE board, which gives us a rare chance to compare how different types of schools deliver learning outcomes.
The caveat, however, is that in most of these states, only a small subset of Government schools follow the CBSE board. These include specialised institutions like Eklavya Model Residential Schools (EMRS) run by the Ministry of Tribal Affairs, Sainik Schools run by the Ministry of Defence, and Army Cantonment Schools. Kendriya Vidyalaya (KV) and Jawahar Navodaya Vidyalaya (JNV) also follow the CBSE board.
KV and JNV are worth mentioning, since they seem to defy the usual government bureaucracy. Part of this could be due to selection bias. KV serves children of Central Government employees and JNV selects its students based on a rigorous scholarship exam. Even so, there are myriad ways to screw this up, and these schools seem to escape the black hole of bureaucratic incompetence. It also helps that the Government treats these schools as prestige projects and invests considerable resources to run them. The results are impressive: KV and JNV schools outperform the average independent school across all states. Barring Meghalaya, students’ pass percentage in KV/JNV schools is >95%. This shows that when there is will and determination, schools can make a difference.
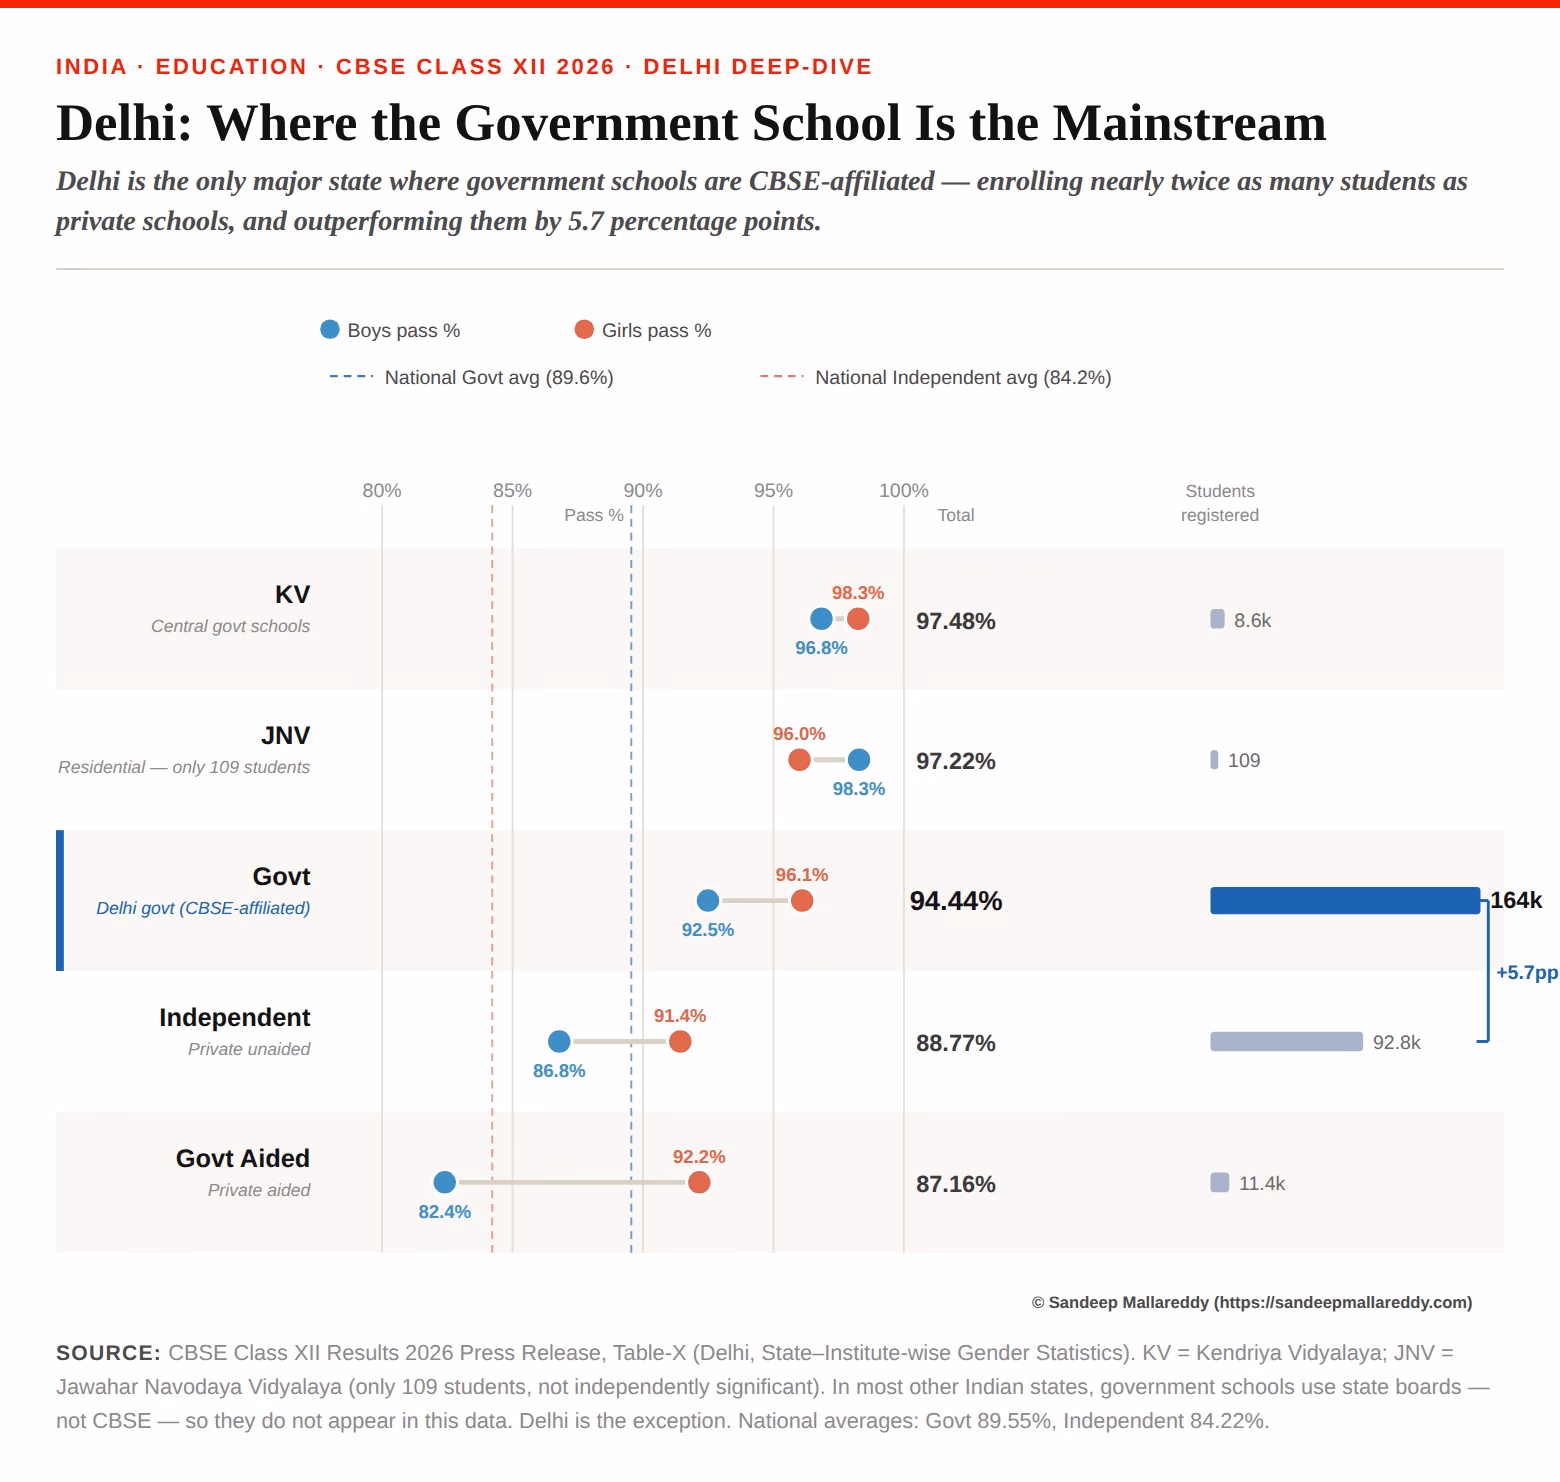
The other result worth looking at is Delhi, where even Government schools follow the CBSE board. Government schools have outperformed independent schools by 5.7 pp. Delhi has really shown that when government has the resolve to improve education, it can do it.
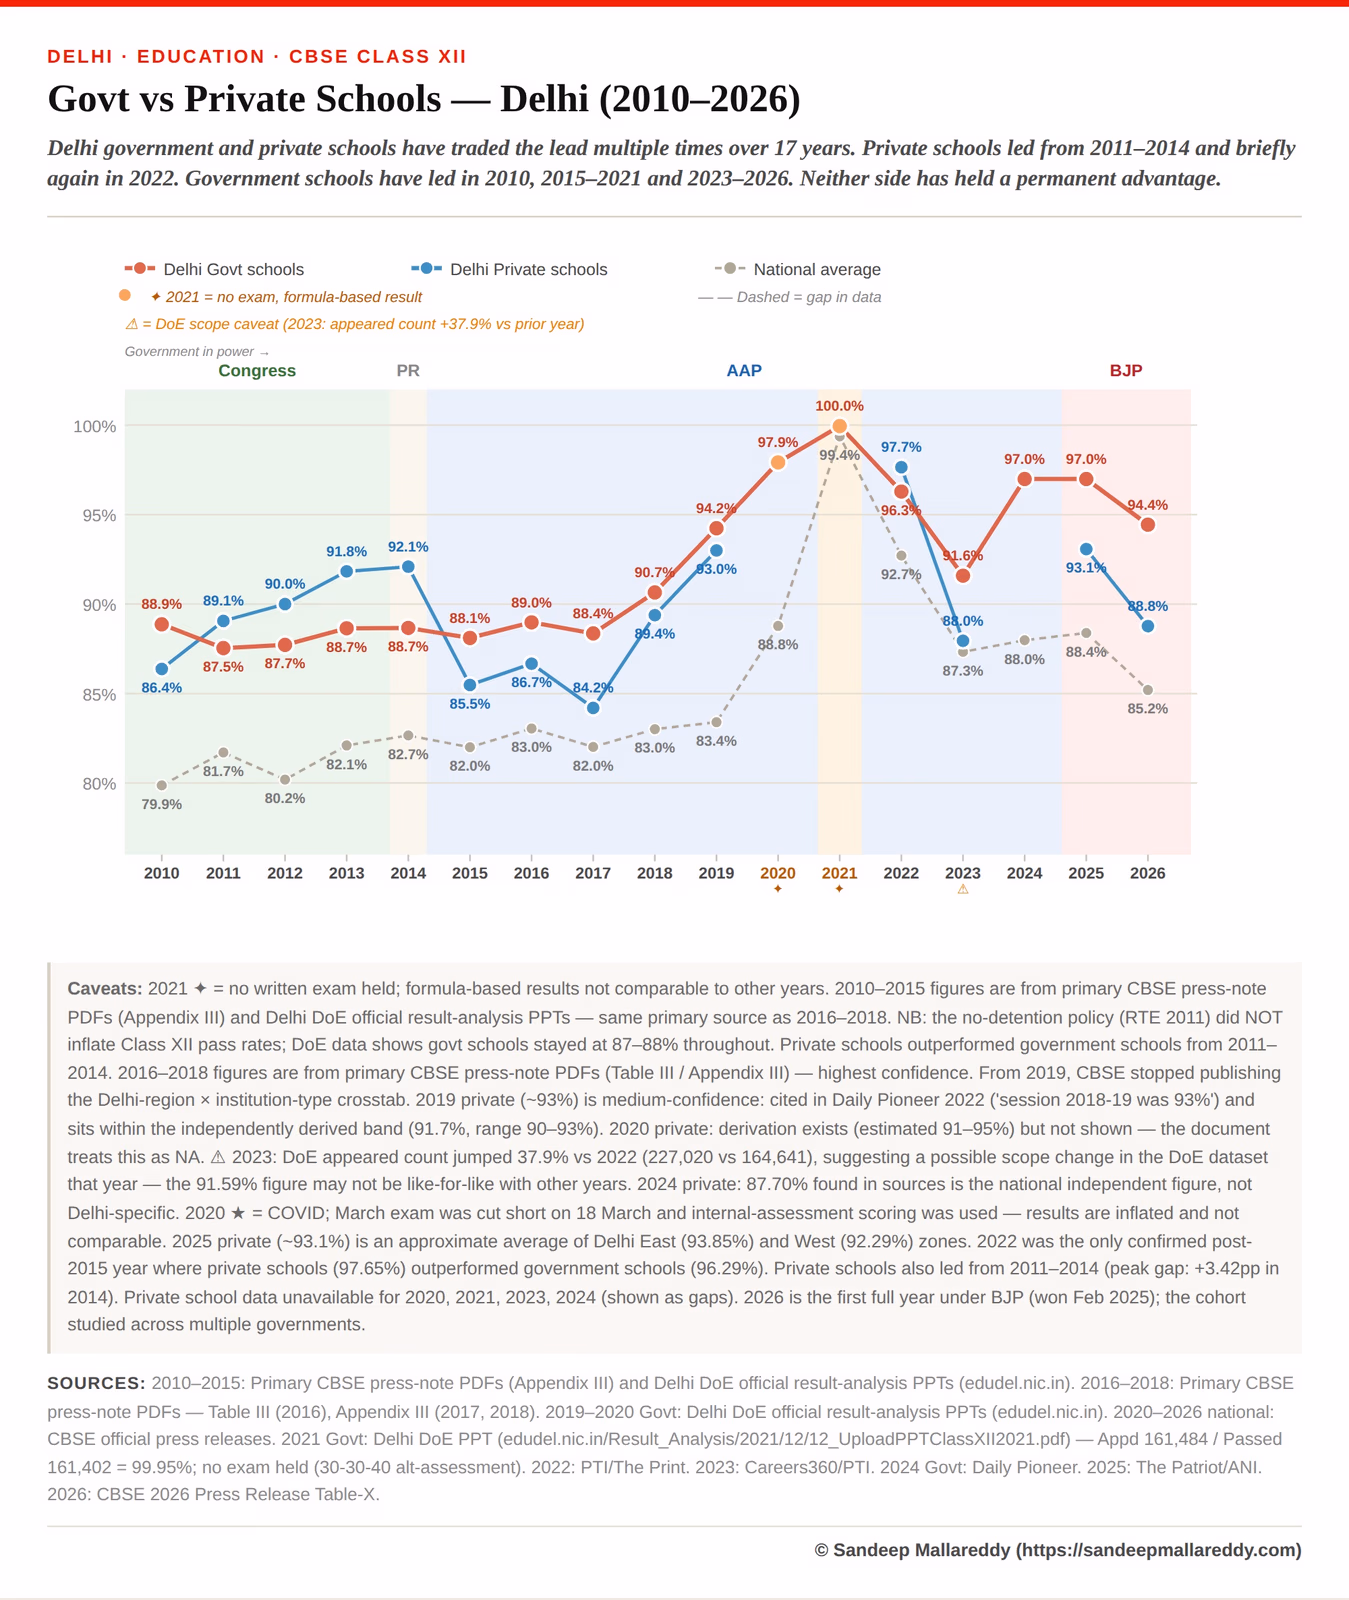
If you follow Delhi politics, it is tempting to credit this to a particular government or policy. That was my assumption too when I started digging into this data.
The chart tells a more honest story. Delhi government schools have outperformed the national average for 17 years straight, across different governments. Private schools led briefly between 2011-14 and again in 2022, but government schools have held the upper hand for most of this period. What is harder to ignore is that both Delhi school types sit well above the national average, and that gap has only grown. Something structural is working in Delhi’s favour, and it predates any single government.
I will caveat this with the fact that accessing consistent private school data from CBSE is harder than it should be, which limits how definitive any of this can be.
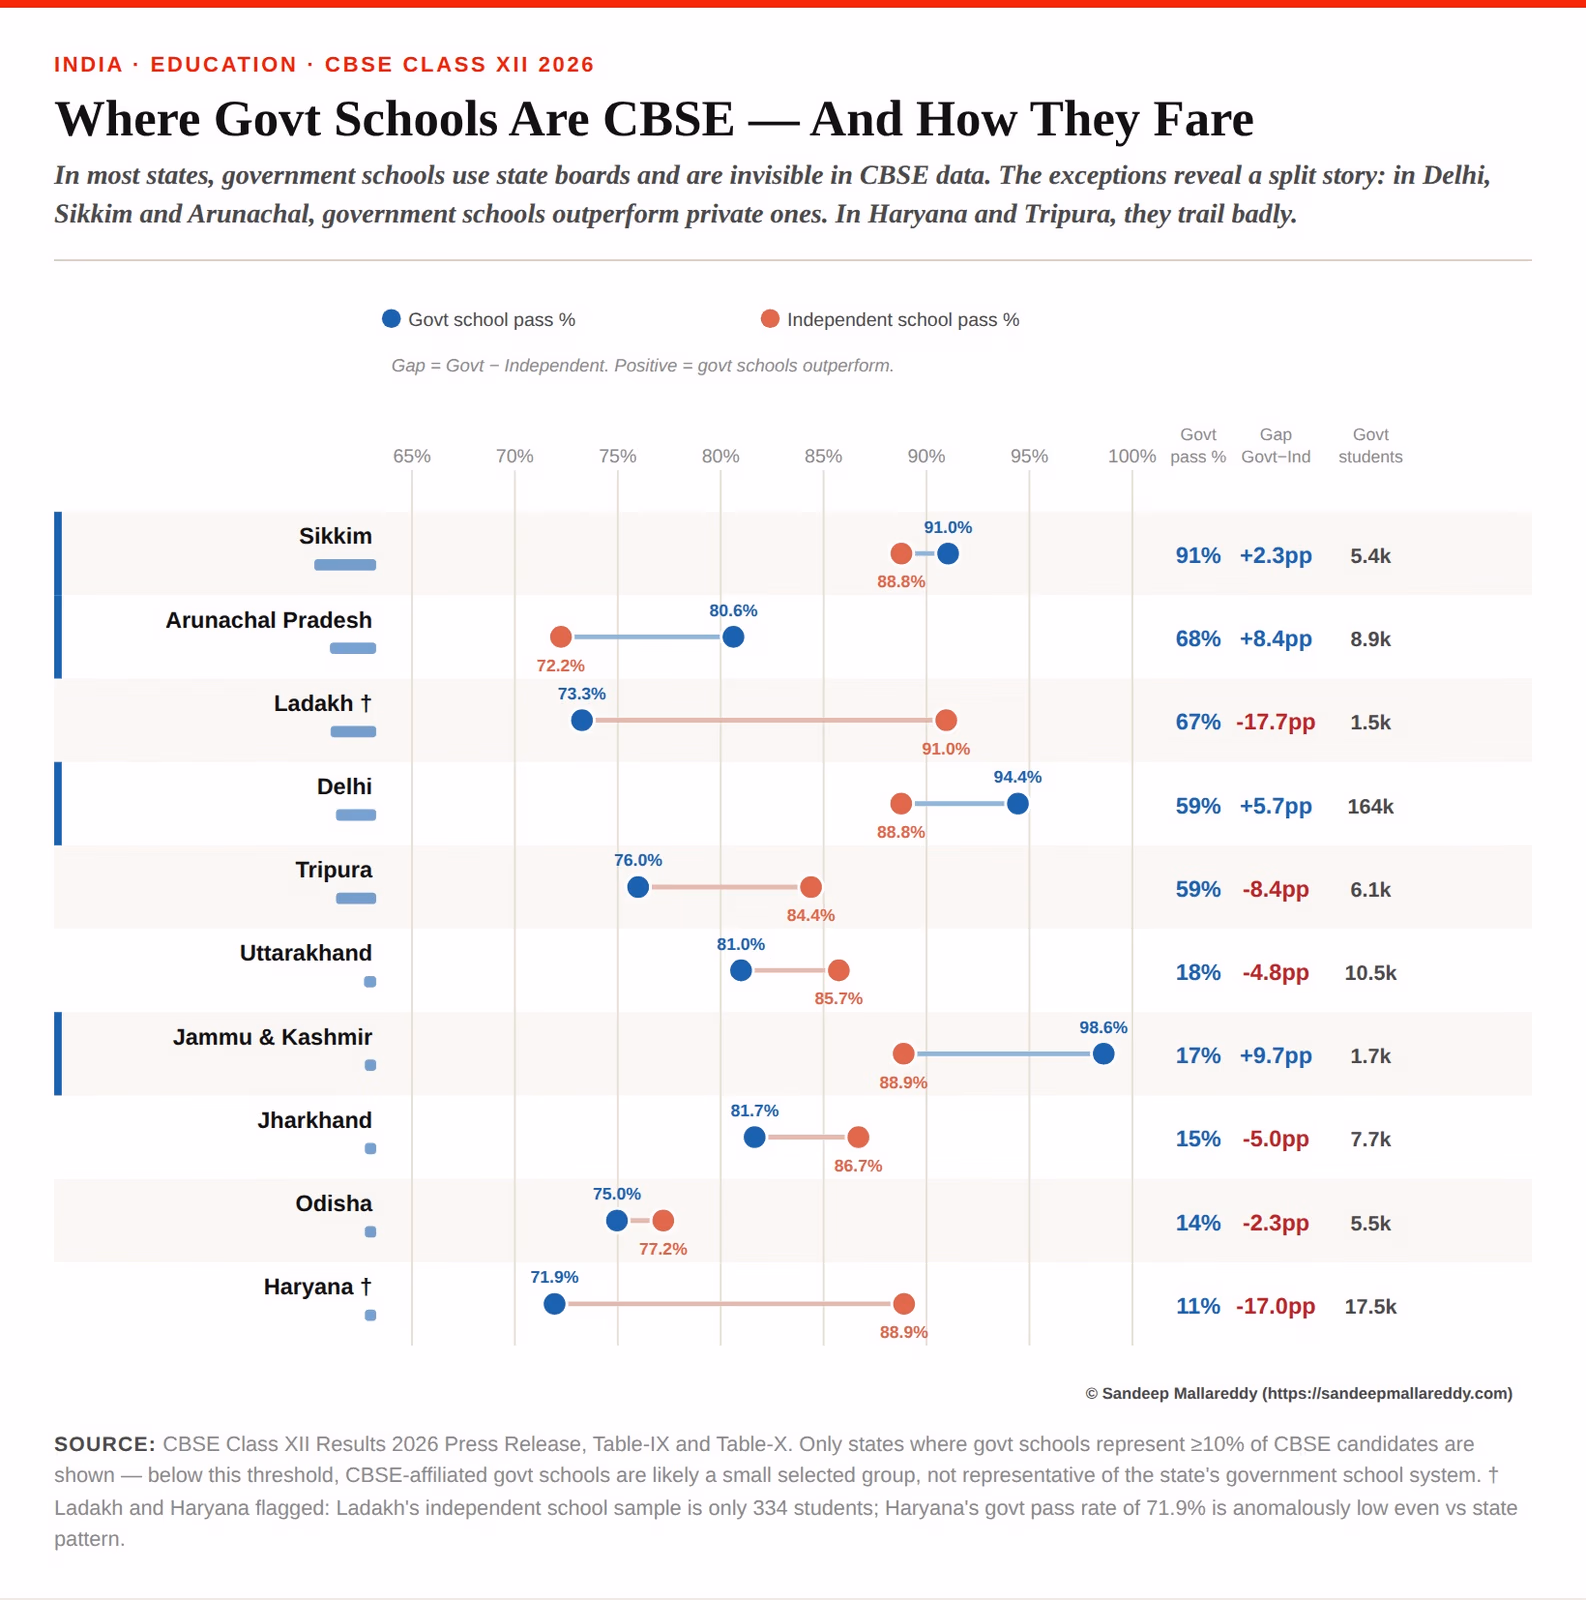
In other states with a considerable Government student population taking the CBSE board exams, results are mixed. In states like Sikkim and Arunachal, Government schools perform marginally better than independent schools, whereas in Haryana and Tripura, you see the opposite. I suspect there is more to this story than just scale. The administrators of these institutions, state or central, need to look inward and learn from neighbours who have had more success
odds worth noting
- Compared to 2025, the number of students placed in compartment (failed in one subject) has grown by 1.6 pp (7.63% to 9.26%).
- The pass percentage of students in foreign schools has dropped by ~4.5 pp compared to 2025 (95.01% to 90.50%). This is likely due to the conflict in the Middle East.
- If you want to score better, take Painting as your elective over Physics. In Painting, 15,334 students scored a perfect 100, versus only 96 in Physics. The press release didn’t share the denominators, but from the numbers, it looks like students do indeed opt for Painting.
- CWSN (Children with Special Needs) students outperformed the national average, passing at 90.16% against the 85.20% national average. 5,718 out of 6,342 who appeared, cleared the exam. A result that deserves more attention than it gets.
I am hoping that more data gets released by CBSE to be able to gather more signal about the state of secondary education in India. For example: more information about performance by grade levels across school types, subjects, states and even districts can prove to be a valuable tool to measure how socioeconomic factors and policy are interacting to explain outcomes. I will post a new updated analysis when I get my hands on more data.
I am not sure who they are supposed to influence other than beat reporters starved for headlines ↩︎
Given 2021 had written exams due to COVID 19 pandemic; results were formula-based (internal assessments + Class X board scores) and are not directly comparable to other years ↩︎
Mizoram and Ladakh are the exceptions where Boys outperform Girls with 1.1p.p and 7 pp respectively ↩︎
Thank you — check your email to confirm.